Guide 22: Hosting capacity with OpenDSS.
Guide 22Overview
Hosting capacity is the maximum distributed energy resources (DER) a transformer or feeder can accommodate without violating voltage or thermal limits. Utilities use hosting capacity analysis to streamline interconnection reviews and identify areas needing infrastructure upgrades.
Methodology
For each of the 490 service transformers in the SP&L model:
- Add a PV system at the transformer secondary bus
- Sweep PV output from 0% to 120% of transformer kVA rating in 13 steps
- Solve power flow at each step
- Record voltage at the secondary bus and maximum line loading
- Hosting capacity = PV level where voltage exceeds 1.05 pu or thermal loading exceeds threshold
6,370 power flow solutions were computed (490 transformers x 13 steps each).
Results
- Transformers analyzed: 490
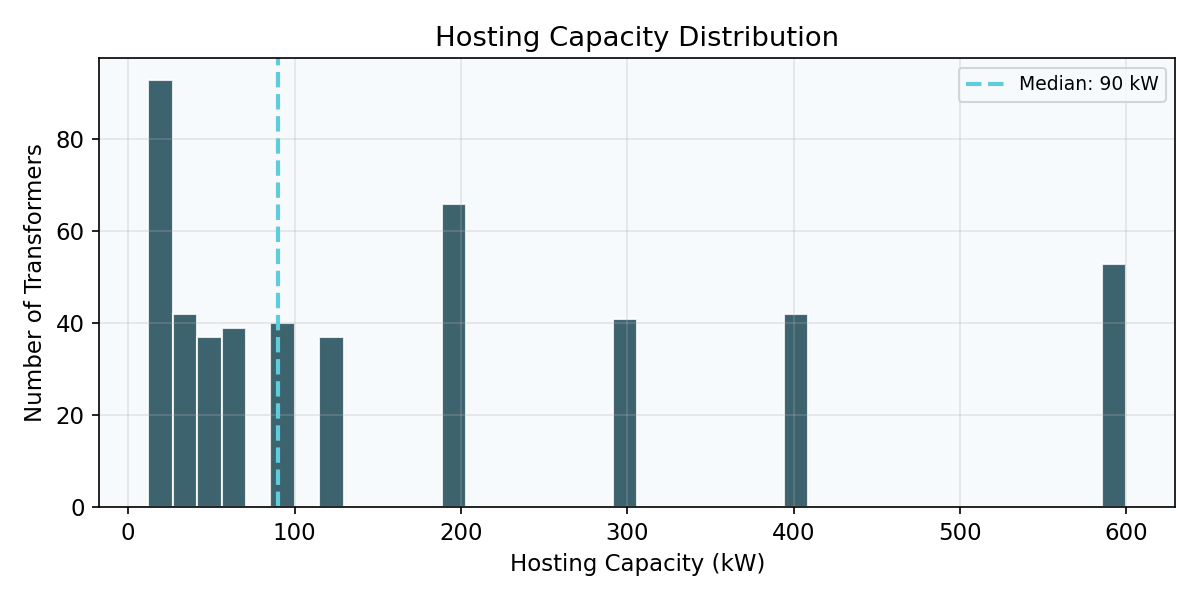
- Mean HC: 181 kW
- Median HC: 90 kW
- Range: 12 - 600 kW
- Existing PV: 264 transformers already have solar installations
The HC distribution is right-skewed: many small residential transformers (10-25 kVA) have limited headroom, while fewer large commercial units (250-500 kVA) can host substantial DER.
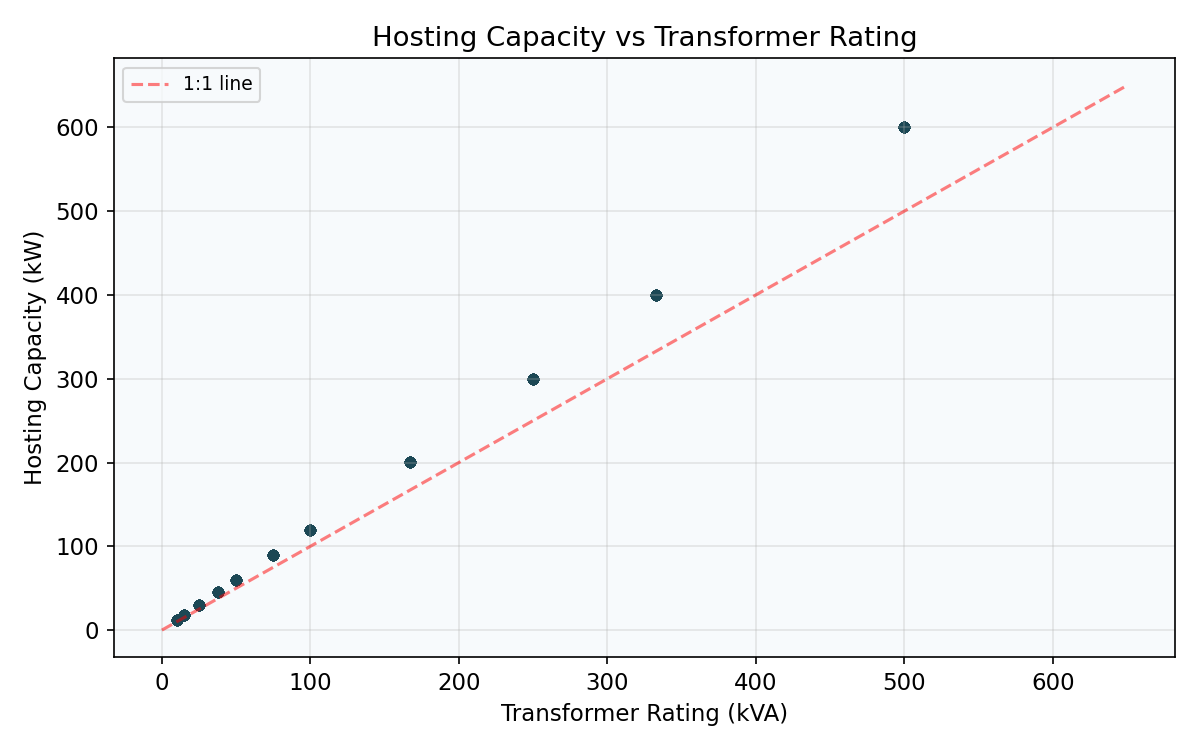
HC vs Transformer Rating
Hosting capacity correlates with transformer size, but network position modulates the relationship. Points below the 1:1 line indicate transformers where voltage or thermal constraints limit HC below the nameplate rating.
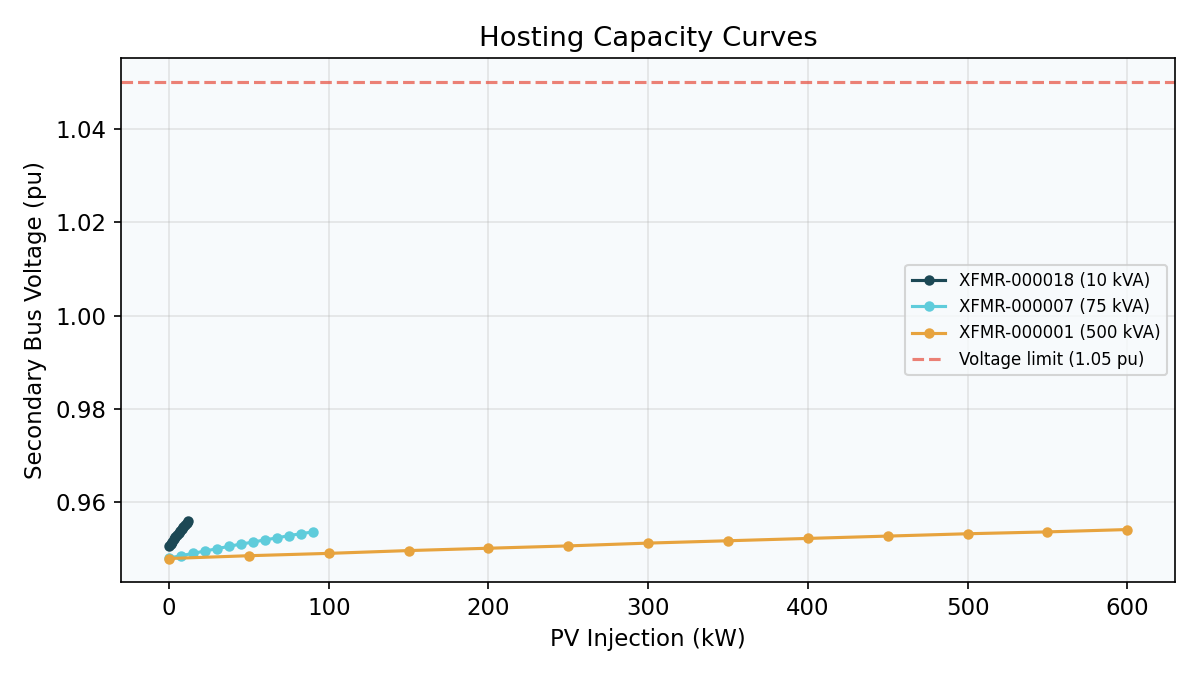
Hosting Capacity Curves
Each curve shows how secondary bus voltage responds to increasing PV injection at a single transformer. The 1.05 pu voltage limit determines the hosting capacity ceiling.
Why Voltage Constraints Matter
Simplified hosting capacity methods estimate HC as a fixed percentage of transformer kVA (typically 80%). This ignores voltage rise from reverse power flow, feeder impedance, and the interaction between adjacent DER installations.
Power-flow-based HC accounts for all of these factors. In the SP&L model, the power flow method shows that HC correlates strongly with transformer size but is modulated by network position -- transformers at feeder endpoints with higher impedance paths have more voltage sensitivity to DER injection.
Related Guides
- Guide 21: OpenDSS Power Flow -- Fundamentals of power flow analysis
- Guide 23: Loss Analysis -- How DER placement affects system losses