Guide 21: OpenDSS power flow analysis.
Guide 21Overview
Power flow analysis calculates voltage at every bus and current through every element in a distribution network. It answers the fundamental question: given the loads, generation, and network topology, what are the resulting voltages and power flows?
This guide walks through the SP&L distribution model compiled and solved with OpenDSS via the opendssdirect.py Python interface.
The SP&L Distribution Model
Model Statistics: 1,492 buses, 2,321 elements, 490 service transformers, 264 PV systems, 70 battery storage systems. Source: 69 kV stepped down to 12.47 kV distribution via a 20 MVA delta-wye substation transformer.
- 1,000 distribution line segments across 12 feeders
- 3 conductor types with realistic impedance values
- Single-phase service transformers (12.47 kV / 0.24 kV)
- Customer loads at 50-80% of transformer rating
- PV systems aggregated by transformer from 28,660 solar installations
- Battery storage from 7,055 installation records
Power Flow Results
The snapshot power flow converges in 2 iterations:
- Total load: 14.0 MW
- System losses: 479 kW (3.4%)
- Voltage range: 0.89 - 1.04 per-unit
- Mean voltage: 0.95 per-unit
Voltage Profile
ANSI C84.1 Range A requires service voltage between 0.95 and 1.05 per-unit. The voltage histogram reveals that most distribution buses operate within acceptable limits, with some feeder endpoints showing voltage drop below 0.95 pu due to long radial runs.
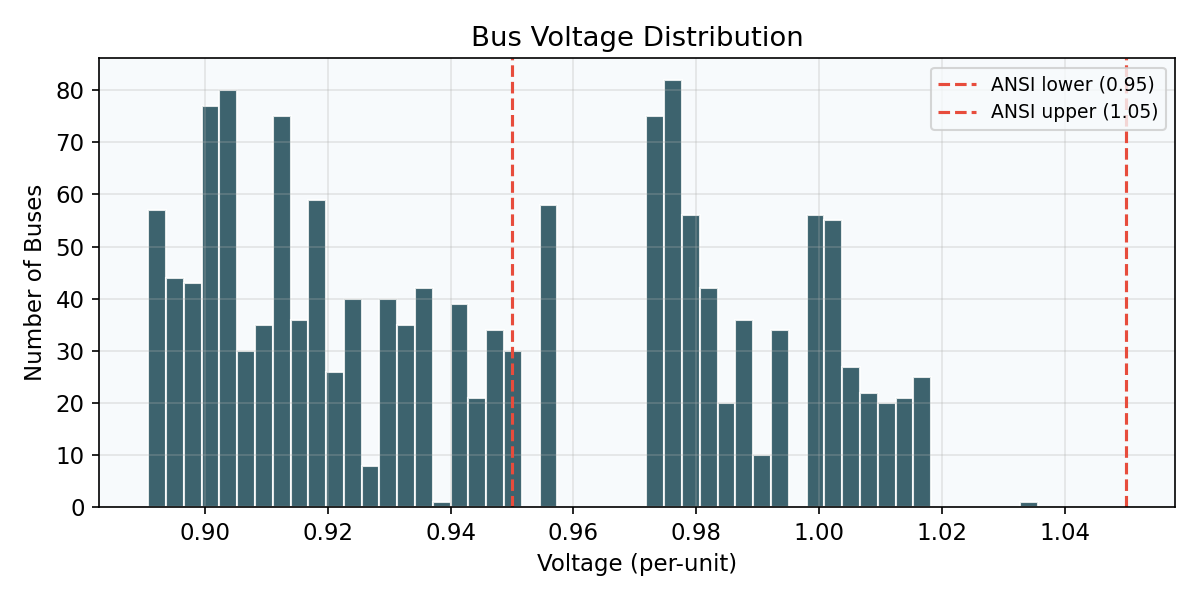
The substation source is set to 1.04 pu (standard utility practice) to compensate for feeder voltage drop under load.
Transformer Loading
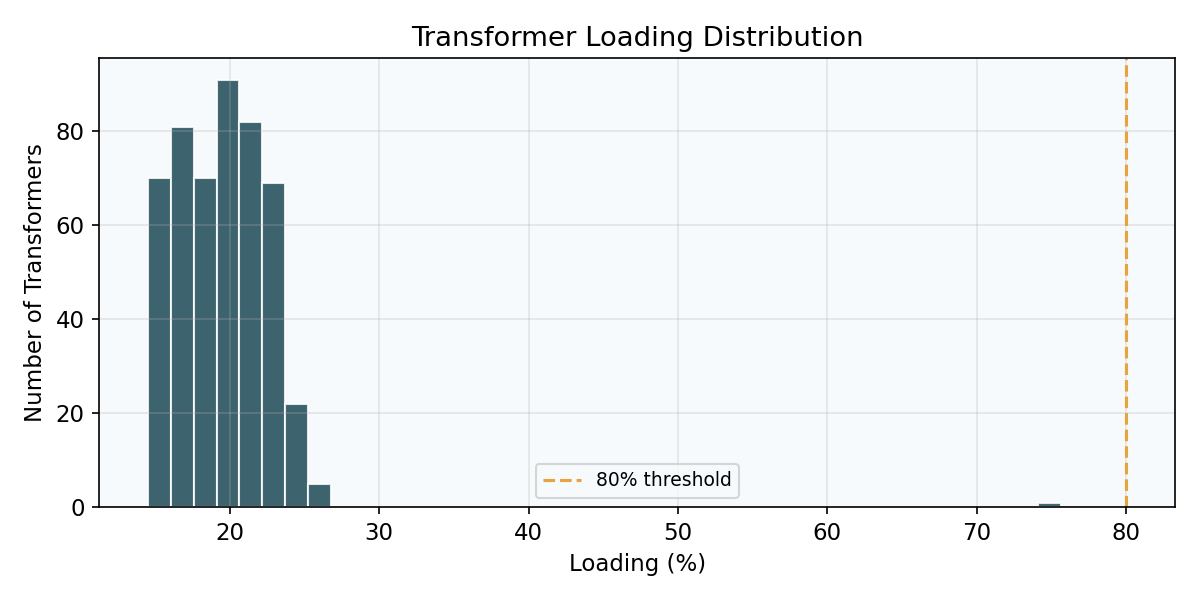
Transformers average ~20% loading with significant headroom for DER growth. No transformers exceed the 80% threshold in the base case.
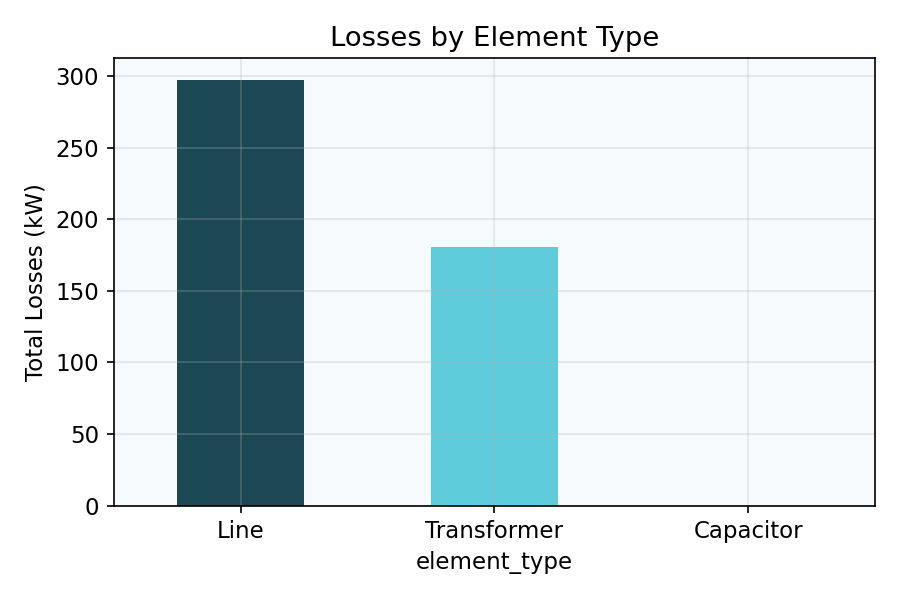
Loss Analysis
Distribution lines dominate system losses through I²R heating. Transformer losses (core + copper) are smaller but significant. The top 20 loss-contributing elements account for a disproportionate share of total losses, indicating that targeted conductor upgrades on key trunk lines would have the highest impact.
Related Guides
- Guide 22: Hosting Capacity with OpenDSS -- Determine how much DER each transformer can host
- Guide 23: Loss Analysis -- Deep dive into loss patterns and reduction strategies